From ferromagnetic semiconductor to antiferromagnetic metal in epitaxial CrxTey monolayers
https://www.nature.com/articles/s41535-025-00772-5 (For more details)
Chromium ditelluride, CrTe2, is an attractive candidate van der Waals material for hosting 2D magnetism. However, how the room-temperature ferromagnetism of the bulk evolves as the sample is thinned to the single-layer limit has proved controversial. This, in part, reflects its metastable nature, vs. a series of more stable self-intercalation compounds with higher relative Cr:Te stoichiometry. Here, exploiting a recently developed method for enhancing nucleation in molecular-beam epitaxy growth of transition-metal chalcogenides, we demonstrate the selective stabilisation of high-coverage CrTe2 and Cr2+εTe3 epitaxial monolayers. Combining X-ray magnetic circular dichroism, scanning tunnelling microscopy, and temperature-dependent angle-resolved photoemission, we demonstrate that both compounds order magnetically with a similar TC. We find, however, that monolayer CrTe2forms as an antiferromagnetic metal, while monolayer Cr2+εTe3 hosts an intrinsic ferromagnetic semiconducting state. This work thus demonstrates that control over the self-intercalation of metastable Cr-based chalcogenides provides a powerful route for tuning both their metallicity and magnetic structure, establishing the CrxTey system as a flexible materials class for future 2D spintronics.

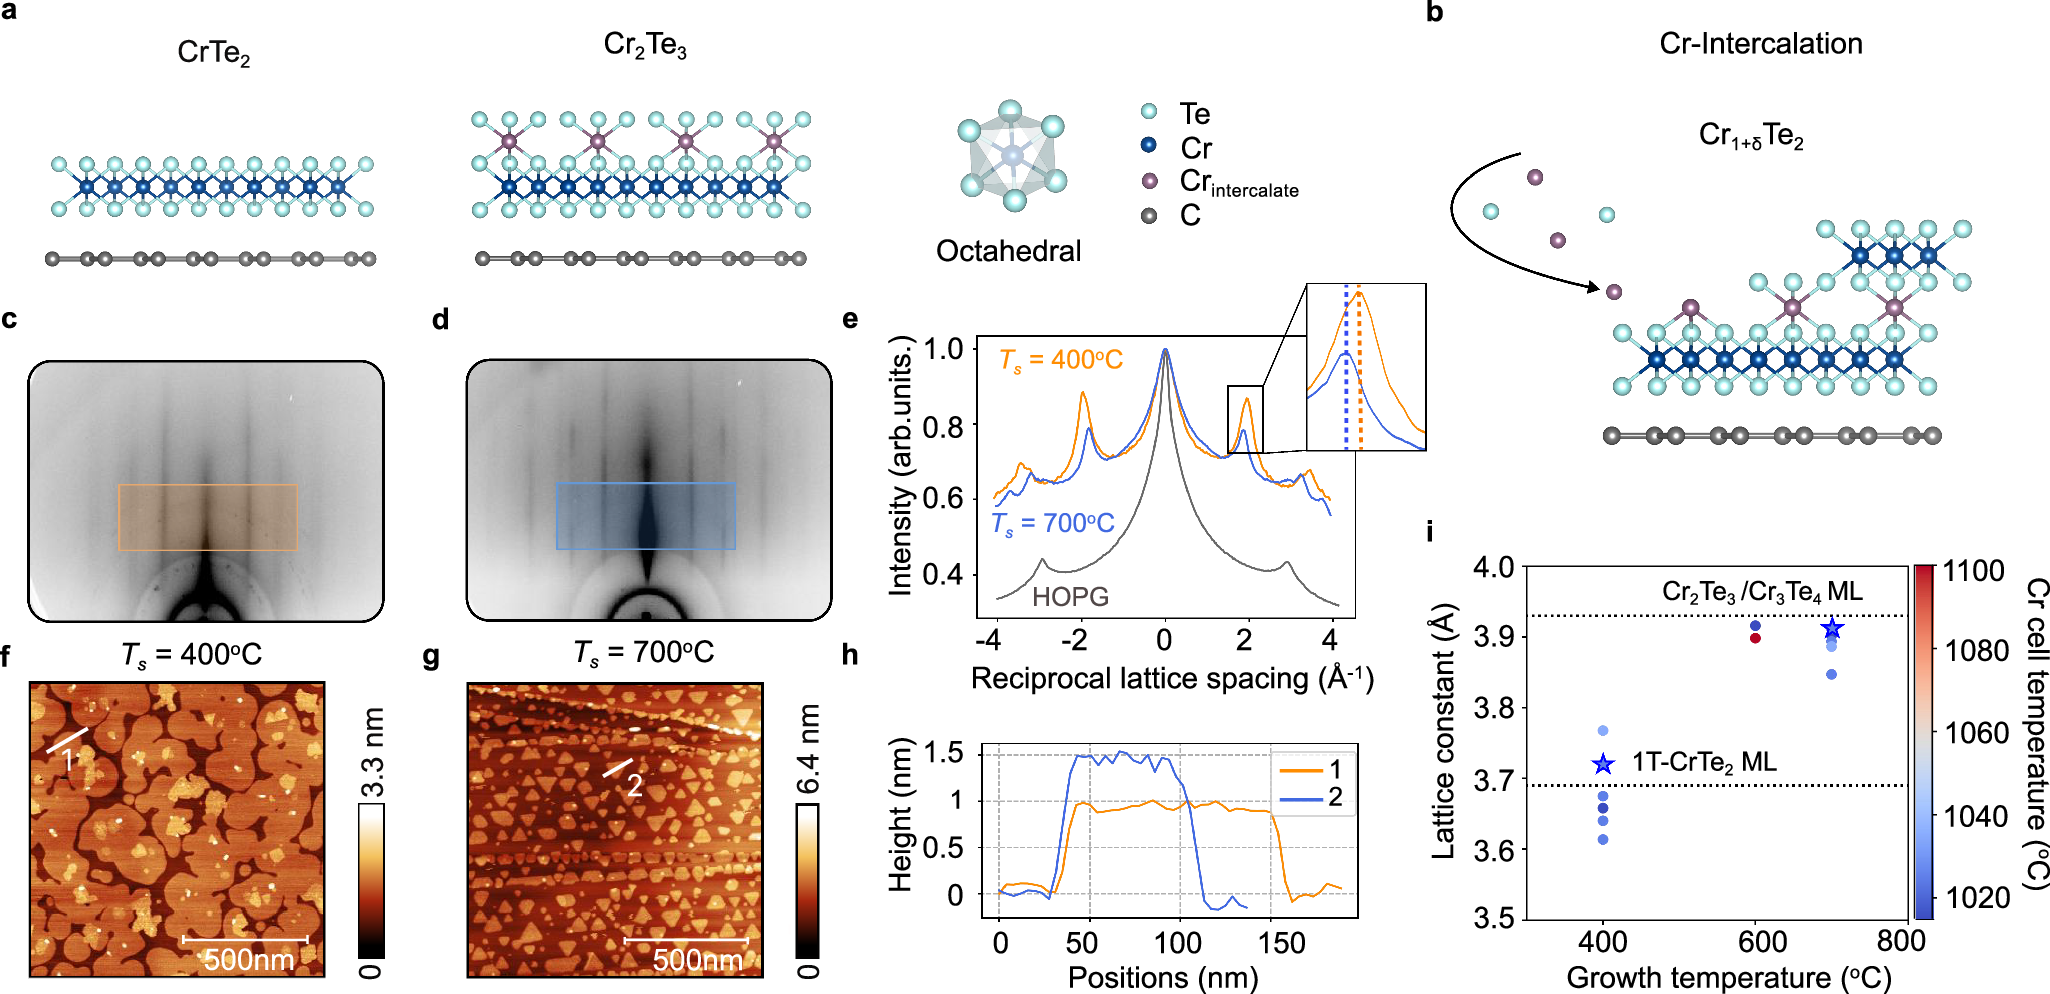
a Side view of the crystal structure of ML-CrTe2 and ML-Cr2Te3 on an HOPG substrate. b Schematic of the formation of the Cr1+δTe2 phases with Cr atoms self-intercalating within the van der Waals gap of CrTe2. c, d RHEED patterns of samples grown at a substrate temperature of (c) Ts = 400 °C and (d) Ts = 700 °C [Cr cell temperature: 1025 °C], and (e) corresponding intensity profiles extracted from the shaded regions in (c, d). The extracted in-plane lattice constants (stars in (i)) are consistent with CrTe2 and [Cr2Te3, Cr3Te4], respectively. f, g AFM images for the samples shown in (c, d). h AFM line profiles corresponding to the lines shown in (f, g), revealing the different thickness of the monolayer islands, again consistent with CrTe2 and [Cr2Te3, Cr3Te4], respectively. i Obtained growth phase diagram of CrxTey as a function of substrate and Cr effusion cell temperature, as determined from lattice constant measurements from RHEED. Stars indicate the in-plane lattice constants as measured from samples for which the corresponding RHEED and AFM images are shown in (c, d, f, g).
Comments:
Login to post a comment